Cacti Dell R750 iDRAC Temperature

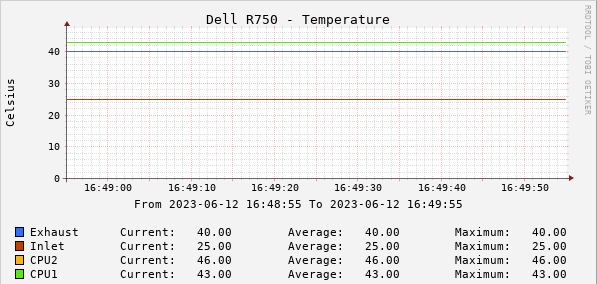
I’ve setup a template to monitor a Dell R750 server via configured SNMP access on iDRAC.

My server has only two CPU (Intel Xeon Gold 6338N). I did not create this as a robust type of template, where it will walk all CPUs. Eventually I’ll get to that, but for now each data source OID is set manually.

Here are the OIDs:

OIDDescription
.1.3.6.1.4.1.674.10892.5.4.700.20.1.6.1.1CPU1 Temp
.1.3.6.1.4.1.674.10892.5.4.700.20.1.6.1.2CPU2 Temp
.1.3.6.1.4.1.674.10892.5.4.700.20.1.6.1.3System Board Inlet Temp
.1.3.6.1.4.1.674.10892.5.4.700.20.1.6.1.4System Board Exhaust Temp

Download

Website Performance Analysis and Graphing – Debian NodeJS + Puppeteer + Cacti

Looking to capture some performance metrics for website from the Linux command line and eventually get it into Cacti (RRD).

Here are my scattered notes on this process. I’m not very familiar with NodeJS stuff, so I’m documenting from installation of NodeJS on Debian 11 to creating the project.

Install NodeJS, Puppeteer and Chromium headless on Debian 11

Install NodeJS

curl -fsSL https://deb.nodesource.com/setup_14.x | sudo -E bash -
apt install -y nodejs

Create Project

mkdir test_project
cd test_project
npm init

Install NodeJS Puppeteer

npm i puppeteer --save

Install Debian dependencies for Chromium

See: https://github.com/puppeteer/puppeteer/blob/main/docs/troubleshooting.md#chrome-headless-doesnt-launch-on-unix

This is what I needed to grab:

apt install libatk-bridge2.0-0 libatk1.0-0 libxcb1 libxcomposite1 libxcursor1 libxdamage1 libxext6 libxrandr2 libxrender1 libgbm1 libxkbcommon-x11-0

Write the Application

This is basic idea copied and modified from something I found online on SO. It takes an argument, the website, passed.

Create index.js:

const puppeteer = require('puppeteer');

(async () => {
        const browser = await puppeteer.launch({
        ignoreDefaultArgs: ['--no-sandbox'],
});
        const page = await browser.newPage();

        const t1 = Date.now();
        await page.goto(process.argv[2], { waitUntil: 'networkidle0'});
        const diff1 = Date.now() - t1;

        await browser.close();
        console.log(`Time: ${diff1}ms`);
})();

To run it:

node app.js https://google.com

Example output:

Time: 1201ms

Integrate with Cacti

TODO

The basic idea is to be able to call the node app.js https://website/ and have it return a metric (milliseconds) that can be stored into an RRD and then graphed upon. Concern would be ensuring that the poller allows for script completion — I’m not sure what would happen if node can’t complete the job before the poller times out.

Other Methods

Some things I scoured from the internet.

Curl

curl -s -w 'Testing Website Response Time for :%{url_effective}\n\nLookup Time:\t\t%{time_namelookup}\nConnect Time:\t\t%{time_connect}\nAppCon Time:\t\t%{time_appconnect}\nRedirect Time:\t\t%{time_redirect}\nPre-transfer Time:\t%{time_pretransfer}\nStart-transfer Time:\t%{time_starttransfer}\n\nTotal Time:\t\t%{time_total}\n' -o /dev/null https://example.com/wp-json/wc/v3
Testing Website Response Time for :https://example.com/wp-json/wc/v3

Lookup Time: 0.004972
Connect Time: 0.053358
AppCon Time: 0.112053
Redirect Time: 0.000000
Pre-transfer Time: 0.112155
Start-transfer Time: 0.746088

Total Time: 0.851602

Cacti: Using Cacti to monitor web page loading

The AskAboutPHP.com has a PHP script to grab some info (not rendering, but at least some of the connection timings) and walks through how to integrate with Cacti for graphing. There are 3 parts:

Part 1: http://www.askaboutphp.com/2008/09/17/cacti-using-cacti-to-monitor-web-page-loading-part-1/

Part 2: http://www.askaboutphp.com/2008/09/19/cacti-using-cacti-to-monitor-web-page-loading-part-2/

Part 3: http://www.askaboutphp.com/2008/09/19/cacti-using-cacti-to-monitor-web-page-loading-part-3/

For modern systems, you’ll need to fix up the pageload-agent.php file to fix the line and remove deprecated and removed function eregi to match the following (line 10):

if (!preg_match('/^https?:\/\//', $url_argv, $matches)) {
                $url_argv = "https://$url_argv";
        }
Cisco WAP571 SNMP poll of apRadioNumAssociatedStations returning 0

For some reason on a Cisco WAP571, the SNMP value returned from apRadioNumAssociatedStations is always zero.

This is true on firmware tested WAP571 (pgwap571, 1.1.0.3).

I have a few of these units around that are not updated to the latest firmware and will test that OID.

I can find data in the apAssocTable to create indexes. For now I’ve created a hack to just snmptable the apAssocTable and count return index values to then pass to Cacti to graph.

snmptable -Cl -CB -Ci -OX -Cb -Cc 16 -Cw 64 -v2c -c <community> <host:port> CISCO-WLAN-ACCESS-POINT-MIB::apAssocTable | grep index | wc -l

Cacti Server

Input Validation Whitelist Protection

Cacti Data Input methods that call a script can be exploited in ways that a non-administrator can perform damage to either files owned by the poller account, and in cases where someone runs the Cacti poller as root, can compromise the operating system allowing attackers to exploit your infrastructure.

Therefore, several versions ago, Cacti was enhanced to provide Whitelist capabilities on the these types of Data Input Methods. Though this does secure Cacti more thouroughly, it does increase the amount of work required by the Cacti administrator to import and manage Templates and Packages.

The way that the Whitelisting works is that when you first import a Data Input Method, or you re-import a Data Input Method, and the script and or aguments change in any way, the Data Input Method, and all the corresponding Data Sources will be immediatly disabled until the administrator validates that the Data Input Method is valid.

To make identifying Data Input Methods in this state, we have provided a validation script in Cacti’s CLI directory that can be run with the following options:

  • php -q input_whitelist.php –audit – This script option will search for any Data Input Methods that are currently banned and provide details as to why.
  • php -q input_whitelist.php –update – This script option un-ban the Data Input Methods that are currently banned.
  • php -q input_whitelist.php –push – This script option will re-enable any disabled Data Sources.

It is strongly suggested that you update your config.php to enable this feature by uncommenting the $input_whitelist variable and then running the three CLI script options above after the web based install has completed.

Cacti Cisco ASA Host Template

Came across a decent host template for Cisco ASA devices that works well with Cacti.
Grab the CISCO-FIREWALL-MIB if you don’t already have them.  Get either Version 1 or Version 2 directly from Cisco and also get CISCO-SMI Version 1 or Version 2:

Determine where your MIBs are stored on your linux system:

linuxhost:~# snmptranslate -Dinit_mib .1.3|grep MIBDIRS
init_mib: Seen MIBDIRS: Looking in [...snip...] for mib dirs ...

You can use wget to download the MIB file version you want and specify where to save it according to one of the paths in the MIBDIRS output…  I like putting them in /usr/share/snmp/mibs.  Make sure the directory exists, if it doesn’t, just issue the following command:

linuxhost:~# mkdir -p /usr/share/snmp/mibs

Now, download the each of the MIBs (CISCO-FIREWALL-MIB and CISCO-SMI).   Use the above links to get a direct link.  I’m getting Version 2 of each of the MIBs.

linuxhost:~# wget -d -O /usr/share/snmp/mibs/CISCO-FIREWALL-MIB "ftp://ftp.cisco.com/pub/mibs/v2/CISCO-FIREWALL-MIB.my"
linuxhost:~# wget -d -O /usr/share/snmp/mibs/CISCO-SMI "ftp://ftp.cisco.com/pub/mibs/v2/CISCO-SMI.my"

After it’s downloaded, run a test on the server and see if you can poll an ASA in your network.  I’ll test the ConnectionStat entry:

linuxhost:~# snmpwalk -m +CISCO-FIREWALL-MIB  -c public -v 2c 192.168.9.253 -OS ConnectionStat
CISCO-FIREWALL-MIB::cfwConnectionStatDescription.protoIp.currentInUse = STRING: number of connections currently in use by the entire firewall
CISCO-FIREWALL-MIB::cfwConnectionStatDescription.protoIp.high = STRING: highest number of connections in use at any one time since system startup
CISCO-FIREWALL-MIB::cfwConnectionStatCount.protoIp.currentInUse = Counter32: 0
CISCO-FIREWALL-MIB::cfwConnectionStatCount.protoIp.high = Counter32: 0
CISCO-FIREWALL-MIB::cfwConnectionStatValue.protoIp.currentInUse = Gauge32: 113
CISCO-FIREWALL-MIB::cfwConnectionStatValue.protoIp.high = Gauge32: 508

It works without errors!
Notice you must specify the CISCO-FIREWALL-MIB using the -m +CISCO-FIREWALL-MIB argument.
To make this load automatically, modify your snmp.conf file.  This is typically located in /etc/snmp/snmp.conf on Sys-V systems;  To figure out where snmp reads it’s configuration file from, issue the following:

linuxhost:~# net-snmp-config --snmpconfpath
/etc/snmp:/usr/share/snmp:/usr/lib/snmp:/root/.snmp:/var/lib/snmp

This shows it checks each of those paths, in order, until it finds the snmp.conf;  So, modify your snmp.conf file and add the following line: mibs +CISCO-FIREWALL-MIB

There may be an existing line mibs : — you can remove the colon and replace it with +CISCO-FIREWALL-MIB.
Next, run the snmpget command without the -m +CISCO-FIREWALL-MIB”and you should have success and no errors.
To get this setup in Cacti, log in to your cacti server as admin. In the console tab, navigate to the “Import Templates” menu item and click on it.

Download the Host Template zip file (from original site http://forums.cacti.net/download/file.php?id=7607 ).
Extract the files to your desktop or wherever.
In the Import Templates window, click “Browse…” and choose the cacti_host_template ZIP file to import.

You are now done.
You can create a new device and choose the Cisco ASA – Security Device from the host templates now.