Monitoring CPU Ready VMware Guest

CPU Ready value is cumulative between the number of vCPUs the VM is assigned. For example, a one vCPU VM has the measurement of 1000ms. For a VM with two vCPUs, the same performance drop would rise to 2000ms, or 1000ms per vCPU. For a VM with four vCPUs, it would be 4000ms.

Realtime Monitoring

CPU Ready / (interval * 1000) * 100 = Performance Penalty

Statistics Rollup Intervals

vCenter defines the following default intervals for rollups:

  • Real-Time: 20s interval (20 seconds)
    • CPU Ready / (20 * 1000) * 100
  • Daily: 5m interval (300 seconds)
    • CPU Ready / (300 * 1000) * 100
  • Past Week: 30m interval (1800 seconds)
    • CPU Ready / (1800 * 1000) * 100
  • Past Month: 2h interval
    • CPU Ready / (7200 * 1000) * 100
  • Past Year: 1d interval
    • CPU Ready / (86400 * 1000) * 100

Real World Examples

Here is a Database server real-time graph.  The average CPU Ready is 609.
609 / 22000 * 100 = 2.76% CPU Ready
width=795

Improving Performance

On this particular DB server, it was configured with 8vCPU.
width=795
After reducing the vCPU from 8 to 4, I used the next available day to review performance improvement (or not).
width=793
I can see now that my average is 7420ms, or 2.76% performance degredation.  Performance improvement of almost 45%!

Speed up Send/Receive in Outlook 2013 Synchronized Folders

Ran into a performance issue for an end-user today where the Send/Receive process was hanging on synchronizing subscribed folders.
One method to help speed up this process was to disable calculating the number of unread items each in subscribed folder that are synchronizing.

Step 1

Click on Send/Receive tab in the Ribbon and then click Send/Receive Groups and choose Define Send/Receive Groups
2016-04-25_113309

Step 2

Click Edit in the right pane
2016-04-25_113317

Step 3

Uncheck Get folder unread count for subscribed folders and click OK
2016-04-25_113331

System and Compressed Memory

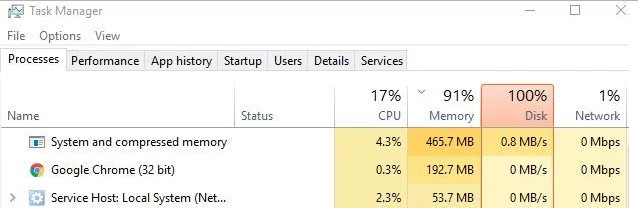
I was looking at my system’s performance (Windows 10 Build 10565) and noticed something I hadn’t seen before “System and compressed memory” utilizing about 500MB. Looking into this further, an explanation from Microsoft is below on this new concept added in Build 10525.


width=638

Memory Manager Improvements:

In Windows 10, we have added a new concept in the Memory Manager called a compression store, which is an in-memory collection of compressed pages. This means that when Memory Manager feels memory pressure, it will compress unused pages instead of writing them to disk. This reduces the amount of memory used per process, allowing Windows 10 to maintain more applications in physical memory at a time. This also helps provide better responsiveness across Windows 10. The compression store lives in the System process’s working set. Since the system process holds the store in memory, its working set grows larger exactly when memory is being made available for other processes. This is visible in Task Manager and the reason the System process appears to be consuming more memory than previous releases.

Reference(s):

  1.  http://blogs.windows.com/windowsexperience/2015/08/18/announcing-windows-10-insider-preview-build-10525/
  2. http://superuser.com/questions/952141/windows-10-system-process-taking-massive-amounts-of-ram
  3. https://channel9.msdn.com/Blogs/Seth-Juarez/Memory-Compression-in-Windows-10-RTM
  4. http://forum.sysinternals.com/need-help-with-ntoskrnl-thread-causing-high-cpu_topic29289_post146738.html#146738

DNS Caching for Spamassassin RBLs

So I’m tweaking the mail filter server which is a Debian Linux server running Postfix, MailScanner and SpamAssassin.

I just wanted to share some of the performance improvements after installing pdns-recursor for local caching.

Install PowerDNS

root@mxfilter:~# apt-get install pdns-recursor

Obtain a sample spam email

root@mxfilter:~# wget http://people.apache.org/~wtogami/sample-spam.eml

First Test

root@mxfilter:~# cat sample-spam.eml | spamassassin -D 2>&1 | grep 'async: timing' | sed 's/^.*dbg: async: //'
timing: 0.740 . dns:A:45.135.176.118.iadb.isipp.com.
timing: 0.741 . dns:A:45.135.176.118.dnsbl.sorbs.net.
timing: 0.749 . dns:TXT:45.135.176.118.sa-accredit.habeas.com.
timing: 0.749 . dns:A:45.135.176.118.bb.barracudacentral.org.
timing: 0.750 . dns:TXT:45.135.176.118.bl.spamcop.net.
timing: 0.752 . dns:A:45.135.176.118.psbl.surriel.com.
timing: 0.753 . dns:A:45.135.176.118.list.dnswl.org.
timing: 0.756 . dns:A:45.135.176.118.zen.spamhaus.org.
timing: 0.758 . dns:A:45.135.176.118.bl.score.senderscore.com.
timing: 1.790 . dns:TXT:45.135.176.118.sa-trusted.bondedsender.org.

Second Test

timing: 0.002 . dns:A:45.135.176.118.iadb.isipp.com.
timing: 0.006 . dns:TXT:45.135.176.118.sa-accredit.habeas.com.
timing: 0.012 . dns:A:45.135.176.118.list.dnswl.org.
timing: 0.016 . dns:A:45.135.176.118.bl.score.senderscore.com.
timing: 0.206 . dns:A:45.135.176.118.psbl.surriel.com.
timing: 0.996 . dns:A:45.135.176.118.dnsbl.sorbs.net.
timing: 1.001 . dns:TXT:45.135.176.118.bl.spamcop.net.
timing: 1.003 . dns:A:45.135.176.118.bb.barracudacentral.org.
timing: 1.003 . dns:TXT:45.135.176.118.sa-trusted.bondedsender.org.
timing: 1.009 . dns:A:45.135.176.118.zen.spamhaus.org.

After running pdns-recursor for about 5 minutes here are some statistics.

root@mxfilter:~# rec_control get-all
all-outqueries  116
dlg-only-drops  0
dont-outqueries 0
outgoing-timeouts       0
tcp-outqueries  4
throttled-out   0
throttled-outqueries    0
unreachables    0
answers-slow    0
answers0-1      0
answers1-10     0
answers10-100   1
answers100-1000 24
case-mismatches 0
chain-resends   0
client-parse-errors     0
edns-ping-matches       0
edns-ping-mismatches    0
ipv6-outqueries 0
no-packet-error 0
noedns-outqueries       120
noerror-answers 15
noping-outqueries       0
nsset-invalidations     0
nxdomain-answers        18
over-capacity-drops     0
qa-latency      893
questions       33
resource-limits 0
server-parse-errors     0
servfail-answers        0
spoof-prevents  0
tcp-client-overflow     0
tcp-questions   0
unauthorized-tcp        0
unauthorized-udp        0
unexpected-packets      0
cache-entries   496
cache-hits      0
cache-misses    25
concurrent-queries      0
negcache-entries        10
nsspeeds-entries        369
packetcache-entries     24
packetcache-hits        8
packetcache-misses      25
sys-msec        36
tcp-clients     0
throttle-entries        0
uptime  462
user-msec       48

Monitor System Performance in AIX

An easy way to get a quick overview of system performance on an AIX server is to use the topas command.

The topas command reports selected statistics about the activity on the local system. The command uses the curses library to display its output in a format suitable for viewing on an 80×25 character-based display or in a window of at least the same size on a graphical display. The topas command requires the bos.perf.tools and perfagent.tools filesets to be installed on the system.

topas topas running
[su_box title=More Information box_color=#2b7abf]http://publib.boulder.ibm.com/infocenter/pseries/v5r3/index.jsp?topic=/com.ibm.aix.cmds/doc/aixcmds5/topas.htm[/su_box]