IBM System X3850 Disable Processor Power Management

In order to work around the issue processor power management has to be disabled in system UEFI and vSphere Client.
To change power policies using server UEFI settings:

  1. Turn on the server.
    Note: If necessary, connect a keyboard, monitor, and mouse to the console breakout cable and connect the console breakout cable to the compute node.
  2. When the prompt ‘Press <F1> Setup’ is displayed, press F1 and enter UEFI setup. Follow the instructions on the screen.
  3. Select System Settings –> Operating Modes and set it to ‘Custom Mode’ as shown in ‘Custom Mode’ figure, then set UEFI settings as follows:
    Choose Operating Mode <Custom>
    Memory Speed <Max Performance>
    Memory Power Management <Disabled>
    Proc Performance States <Disabled>
    C1 Enhanced Mode <Disabled>
    QPI Link Frequency <Max Performance>
    QPI Link Disable <Enable All Links>
    Turbo Mode <Enable>
    CPU C-States <Disable>
    Power/Performance Bias <Platform Controlled>
    Platform Controlled Type <Maximum Performance>
    Uncore Frequency Scaling <Disable>

  4. Press Escape key 3 times, and Save Settings.
  5. Exit Setup and restart the server so that UEFI changes take effect.

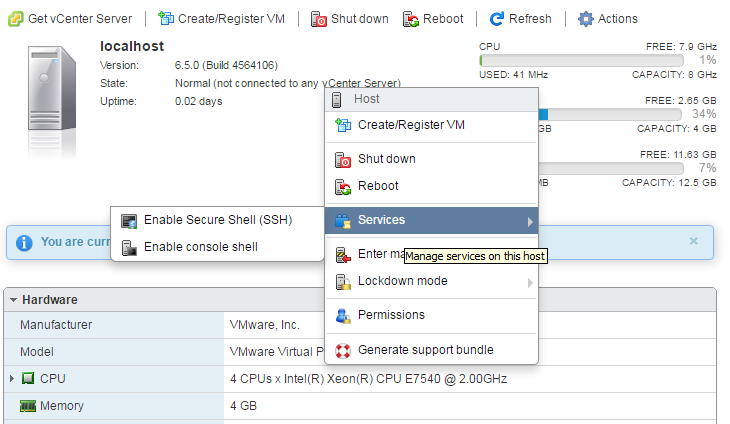
Next, change power policies using the vSphere Client:

  1. Select the host from the inventory and click the Manage tab and then the Settings tab as shown in ‘Power Management view from the vSphere Web Client’ figure.
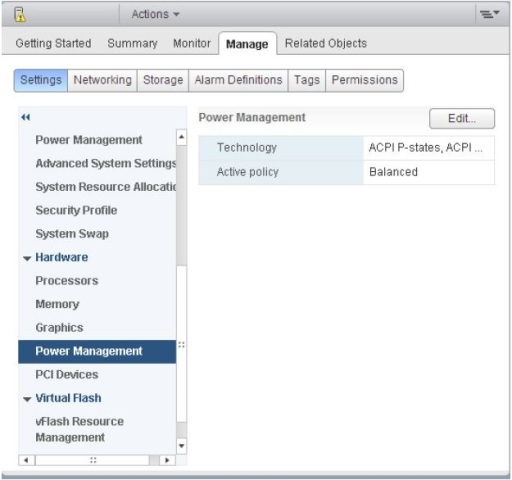
  2. In the left pane under Hardware, select Power Management.
  3. Click Edit on the right side of the screen.
  4. The Edit Power Policy Settings dialog box appears as shown in ‘Power policy settings’ figure.
  5. Choose ‘High performance’ and confirm selection by pressing ‘OK’ radio button.

My Notes and Benchmarks on VMware Flash Read Cache

I’ve spent some time exploring and studying the use and configuration of VMware Flash Read Cache (vFRC) and its benefits.  These are my notes.
Useful Resources

On a guest virtual machine, vFRC is configured in Disk configuration area.  The virtual machine needs to be on version 10 hardware.  vSphere needs to be minimum version 5.5.
width=592

Benchmarks

I took a baseline benchmark of a simple Windows Server 2016 virtual machine that had a thin provisioned 20GB disk using DskSpd (formerly sqlio).  The virtual machine disk disk is connected to an IBM DS3400 LUN with 4 x 300GB 15k RPM disks in RAID-10.
Baseline Virtual Machine

  • OS: Windows Server 2016
  • vCPU: 1
  • vRAM: 4GB
  • SCSI Controller: LSI Logic SAS
  • Virtual Disk:  40GB thin provisioned
  • Virtual machine hardware:  vmx-10
  • Virtual Flash Read Cache: 0

Some notes before running a test.  This is geared toward SQL workloads and identifies the type of I/O for the different SQL workload.
width=1091
DskSpd test

diskspd.exe -c30G -d300 -r -w0 -t8 -o8 -b8K -h -L E:	estfile.dat

Results of testing.

Command Line: diskspd.exe -c30G -d300 -r -w0 -t8 -o8 -b8K -h -L E:	estfile.dat
Input parameters:
        timespan:   1
        -------------
        duration: 300s
        warm up time: 5s
        cool down time: 0s
        measuring latency
        random seed: 0
        path: 'E:	estfile.dat'
                think time: 0ms
                burst size: 0
                software cache disabled
                hardware write cache disabled, writethrough on
                performing read test
                block size: 8192
                using random I/O (alignment: 8192)
                number of outstanding I/O operations: 8
                thread stride size: 0
                threads per file: 8
                using I/O Completion Ports
                IO priority: normal
Results for timespan 1:
*******************************************************************************
actual test time:       301.18s
thread count:           8
proc count:             1
CPU |  Usage |  User  |  Kernel |  Idle
-------------------------------------------
   0|  99.23%|   7.05%|   92.18%|   0.77%
-------------------------------------------
avg.|  99.23%|   7.05%|   92.18%|   0.77%
Total IO
thread |       bytes     |     I/Os     |     MB/s   |  I/O per s |  AvgLat  | LatStdDev |  file
-----------------------------------------------------------------------------------------------------
     0 |      7940784128 |       969334 |      25.14 |    3218.43 |    2.471 |    22.884 | E:	estfile.dat (30GB)
     1 |      8152604672 |       995191 |      25.81 |    3304.28 |    2.401 |    22.211 | E:	estfile.dat (30GB)
     2 |      8116256768 |       990754 |      25.70 |    3289.55 |    2.408 |    22.080 | E:	estfile.dat (30GB)
     3 |      8180006912 |       998536 |      25.90 |    3315.38 |    2.394 |    22.936 | E:	estfile.dat (30GB)
     4 |      8192147456 |      1000018 |      25.94 |    3320.30 |    2.395 |    22.569 | E:	estfile.dat (30GB)
     5 |      8283185152 |      1011131 |      26.23 |    3357.20 |    2.375 |    21.607 | E:	estfile.dat (30GB)
     6 |      7820320768 |       954629 |      24.76 |    3169.60 |    2.508 |    21.745 | E:	estfile.dat (30GB)
     7 |      7896784896 |       963963 |      25.00 |    3200.59 |    2.479 |    21.981 | E:	estfile.dat (30GB)
-----------------------------------------------------------------------------------------------------
total:       64582090752 |      7883556 |     204.49 |   26175.34 |    2.428 |    22.258
Read IO
thread |       bytes     |     I/Os     |     MB/s   |  I/O per s |  AvgLat  | LatStdDev |  file
-----------------------------------------------------------------------------------------------------
     0 |      7940784128 |       969334 |      25.14 |    3218.43 |    2.471 |    22.884 | E:	estfile.dat (30GB)
     1 |      8152604672 |       995191 |      25.81 |    3304.28 |    2.401 |    22.211 | E:	estfile.dat (30GB)
     2 |      8116256768 |       990754 |      25.70 |    3289.55 |    2.408 |    22.080 | E:	estfile.dat (30GB)
     3 |      8180006912 |       998536 |      25.90 |    3315.38 |    2.394 |    22.936 | E:	estfile.dat (30GB)
     4 |      8192147456 |      1000018 |      25.94 |    3320.30 |    2.395 |    22.569 | E:	estfile.dat (30GB)
     5 |      8283185152 |      1011131 |      26.23 |    3357.20 |    2.375 |    21.607 | E:	estfile.dat (30GB)
     6 |      7820320768 |       954629 |      24.76 |    3169.60 |    2.508 |    21.745 | E:	estfile.dat (30GB)
     7 |      7896784896 |       963963 |      25.00 |    3200.59 |    2.479 |    21.981 | E:	estfile.dat (30GB)
-----------------------------------------------------------------------------------------------------
total:       64582090752 |      7883556 |     204.49 |   26175.34 |    2.428 |    22.258
Write IO
thread |       bytes     |     I/Os     |     MB/s   |  I/O per s |  AvgLat  | LatStdDev |  file
-----------------------------------------------------------------------------------------------------
     0 |               0 |            0 |       0.00 |       0.00 |    0.000 |       N/A | E:	estfile.dat (30GB)
     1 |               0 |            0 |       0.00 |       0.00 |    0.000 |       N/A | E:	estfile.dat (30GB)
     2 |               0 |            0 |       0.00 |       0.00 |    0.000 |       N/A | E:	estfile.dat (30GB)
     3 |               0 |            0 |       0.00 |       0.00 |    0.000 |       N/A | E:	estfile.dat (30GB)
     4 |               0 |            0 |       0.00 |       0.00 |    0.000 |       N/A | E:	estfile.dat (30GB)
     5 |               0 |            0 |       0.00 |       0.00 |    0.000 |       N/A | E:	estfile.dat (30GB)
     6 |               0 |            0 |       0.00 |       0.00 |    0.000 |       N/A | E:	estfile.dat (30GB)
     7 |               0 |            0 |       0.00 |       0.00 |    0.000 |       N/A | E:	estfile.dat (30GB)
-----------------------------------------------------------------------------------------------------
total:                 0 |            0 |       0.00 |       0.00 |    0.000 |       N/A
  %-ile |  Read (ms) | Write (ms) | Total (ms)
----------------------------------------------
    min |      0.068 |        N/A |      0.068
   25th |      0.261 |        N/A |      0.261
   50th |      0.274 |        N/A |      0.274
   75th |      0.305 |        N/A |      0.305
   90th |      0.413 |        N/A |      0.413
   95th |      3.097 |        N/A |      3.097
   99th |     57.644 |        N/A |     57.644
3-nines |    198.563 |        N/A |    198.563
4-nines |    995.725 |        N/A |    995.725
5-nines |   1896.496 |        N/A |   1896.496
6-nines |   1954.282 |        N/A |   1954.282
7-nines |   1954.318 |        N/A |   1954.318
8-nines |   1954.318 |        N/A |   1954.318
9-nines |   1954.318 |        N/A |   1954.318
    max |   1954.318 |        N/A |   1954.318

The important part of this shows that at 204MB/s throughput and 26k IOPs, I had average 2ms latency.

thread |       bytes     |     I/Os     |     MB/s   |  I/O per s |  AvgLat  | LatStdDev
----------------------------------------------------------------------------------------
total:       64582090752 |      7883556 |     204.49 |   26175.34 |    2.428 |    22.258

Here is a view from my monitoring software, essentially validating the latency.
width=850
A good starting point for SQL workload testing would be something like:

diskspd –b8K –d30 –o4 –t8 –h –r –w25 –L –Z1G –c20G D:iotest.dat > DiskSpeedResults.txt

At this point, I just need to get the SSD installed on the host and test VMware Flash Read Cache.
To be continued…

VMware vSphere 6.5 Test Drive

This will be an evolving post as I document/note the installation process and some configuration and testing.
I’m installing VMware vSphere 6.5 under my current virtualization platform to give it a spin. I’m most curious about the web interface, now that it has moved exclusively in that direction. I *HOPE* it is much better than my current vSphere 5.5 U1 deployment.

9:39PM Installation

So far, installation is going well.  As a simple test setup, I created a virtual machine on my current vSphere 5.5 system with 20GB HDD, 4vCPU (1 socket, 4 core), and 4GB RAM.
The only alert I’ve received at this point is compatibility for the host CPU – probably because of nesting?

9:53PM Installation Completed

Looks like things went well, so far.  Time to reboot and check it out.

9:58PM Post Install

Sweet, at least it booted.  Time to hit the web interface.

Login screen at the web interface looks similar to 5.5.

The web console is night and day performance difference over vSphere 5.5.  I’m totally liking this!

10:30PM vFRC (vSphere Flash Read Cache)

I just realized, after 10 minutes of searching through the new interface, that I cannot configure vFRC in the webconsole of the host.  I need to do this with vCenter Server -or- through the command line.  So, off to the command line I go.
First, I enabled SSH on the host which is easy enough by right-clicking and choosing Services > Enable Secure Shell (SSH).

After SSH was enabled, I logged in.  Not knowing anything much about what commands were available, I gave it a shot with esxcli storage just to see what I could see.  I saw vflash.  Cool, haha.

Next, I dig into that with esxcli storage vflash and see what I have available.  Sweet mother, I have cache, module and device namespaces.  Ok, I went further and chose device.  So the rabbit hole stops here, but I had no idea of what available {cmd}‘s I had were.  A quick thing I remember from some time ago combined with grep gets me what I want.  Alright, alright, alright!

Knowing I have zero SSD SATA/SAS/PCIe connected, I did the inevitable.  I checked to see what SSD disks were attached to my hypervisor.  Can you guess, like myself, that the answer is zero?  VMware doesn’t even care about responding with “You don’t have any SSD disks attached.”  Just an empty response.  I’m cool with that.

So this is where I’ll leave it for now.  I’ll attach an SSD disk and continue this article soon.

Monitoring CPU Ready VMware Guest

CPU Ready value is cumulative between the number of vCPUs the VM is assigned. For example, a one vCPU VM has the measurement of 1000ms. For a VM with two vCPUs, the same performance drop would rise to 2000ms, or 1000ms per vCPU. For a VM with four vCPUs, it would be 4000ms.

Realtime Monitoring

CPU Ready / (interval * 1000) * 100 = Performance Penalty

Statistics Rollup Intervals

vCenter defines the following default intervals for rollups:

  • Real-Time: 20s interval (20 seconds)
    • CPU Ready / (20 * 1000) * 100
  • Daily: 5m interval (300 seconds)
    • CPU Ready / (300 * 1000) * 100
  • Past Week: 30m interval (1800 seconds)
    • CPU Ready / (1800 * 1000) * 100
  • Past Month: 2h interval
    • CPU Ready / (7200 * 1000) * 100
  • Past Year: 1d interval
    • CPU Ready / (86400 * 1000) * 100

Real World Examples

Here is a Database server real-time graph.  The average CPU Ready is 609.
609 / 22000 * 100 = 2.76% CPU Ready
width=795

Improving Performance

On this particular DB server, it was configured with 8vCPU.
width=795
After reducing the vCPU from 8 to 4, I used the next available day to review performance improvement (or not).
width=793
I can see now that my average is 7420ms, or 2.76% performance degredation.  Performance improvement of almost 45%!

Sysprep Windows Server 2016 for Virtualization

Finally getting around to installing Windows Server 2016 (Standard, Desktop Experience) to use for application testing and upgrade plans this year.  I haven’t tested this release since Technical Preview 5 which had introduced the Nano edition.

I plan to create a sysprep image of the virtual machine so I can quickly deploy the system in the future.
What is sysprep?

The System Preparation (Sysprep) tool prepares an installation of Windows for duplication, auditing, and customer delivery. Duplication, also called imaging, enables you to capture a customized Windows image that you can reuse throughout an organization. Audit mode enables you to add additional device drivers or applications to a Windows installation. After you install the additional drivers and applications, you can test the integrity of the Windows installation. Sysprep also enables you to prepare an image to be delivered to a customer. When the customer boots Windows, Windows Welcome starts.

Since Windows 8 and Server 2012, there is a new command line switch for sysprep, /mode:vm.
Note:  This switch is only supported for virtual machines.  You can’t mix and match Hyper-V VMs and VMWare VMs.  Also, you cannot deploy this image to physical machine.

Install Windows Server 2016

First thing’s first, I’m going to install Windows Server 2016 Standard Desktop Experience.
Minimum System Requirements for Windows Server 2016 Standard (Desktop Experience):

  • 1.4 GHz 64-bit EMT64 or AMD64 processor
  • Support for security features like NX Bit and DEP (Data Execution Prevention)
  • The processor should support CMPXCHG16b, LAHF/SAHF, and PrefetchWNeeds
  • Needs to Support EPT or NPT (Second Level Address Translation)
  • 32GB disk space for Core, 4GB additional for GUI (Desktop Experience)
  • Needs to be a PCI Express Compliant Disk Controller.
  • ATA/PATA/IDE/EIDE are not supported for either boot, page, or data.

For my base system, I’m using a 50GB disk, 4GB RAM, and 1 socket, 2 core 2GHz vCPU.

Now that the base operating system is installed, I will do a few maintenance tasks that I like to do to my systems.

  • Windows Updates
  • Change Performance to High Performance

Once that is done, I can sysprep.

Sysprep the Windows Server VM

As noted above, the new flag (since Windows 8/Server 2012) /mode:vm allows for faster deployment, but you can’t switch between hypervisors after it is made and it cannot be deployed to physical hardware.  Once the sysprep is completed, the resulting VHD can be copied and attached to a new VM quickly.

c:\windows\system32\sysprep\sysprep.exe /oobe /generalize /shutdown /mode:vm

It will shutdown after sysprep completes, and at this point I can now simply clone the virtual machine to a new virtual machine.

After sysprep completes, I Clone the virtual machine in VMWare.  Once cloned, I power the virtual machine on and fill in the information at first startup as shown in the screenshots below.